


Many investors want to invest in good stocks but don’t know how to analyze a company’s fundamentals. Let’s understand how we can analyze Balance Sheets in a simple way: A Complete overview. Credit: My Broker who provided me the details.
The balance sheet is one of the three major financial statements. ‘At a fixed point of time’, it shows a company’s
- Assets: What it owns
- Liabilities: What it owes
- Shareholders Equity: Its net-worth

A balance sheet is a SNAPSHOT of a company’s net worth. It is measured at the end of a Quarter/Year.
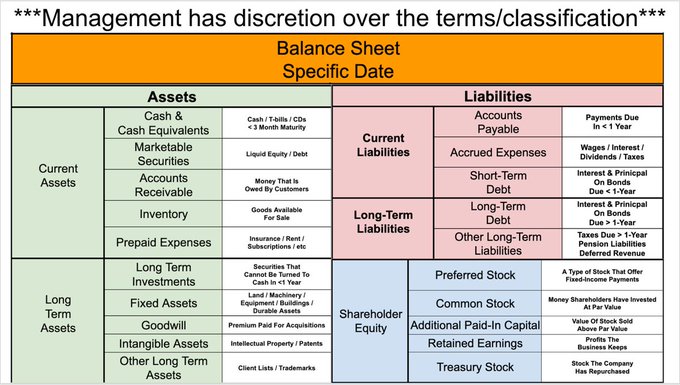
Management teams have leeway in categorizing their balance sheet. This means that not all balance sheets look the same. Here are some of the most commonly used terms and what they mean:
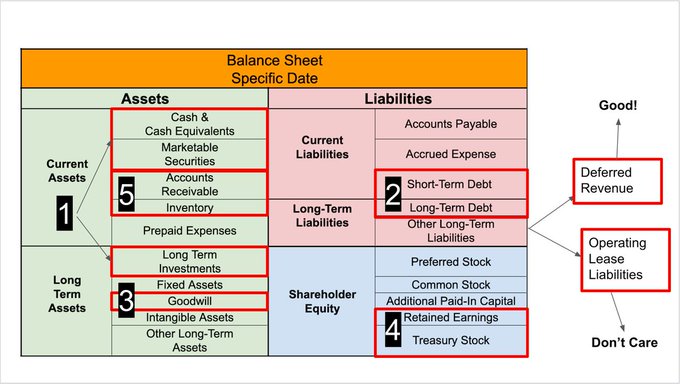
What we need to focus on first:
- Cash & Equivalents: How much?
- Debt: How much? What kind?
- Goodwill: How much?
- Retained Earnings (+ T.S.): Positive?
- Receivables & Inventory: How much?
Best Possible Answers may be:
- Cash & Equivalents: Millions / Billions (depends on company size)
- Debt: None
- Retained Earnings (+ T.S.): Positive
- Receivables & Inventory: None
Other areas to quickly look at:
- Working Capital (Ideally Negative)
- Operating Lease Liabilities (Ignore)
- Deferred Revenue (hopefully has some)
It is also helpful to look at a few simple balance sheet ratios (attached pic). Many such information is also available free on many websites. I hope this thread was useful.
